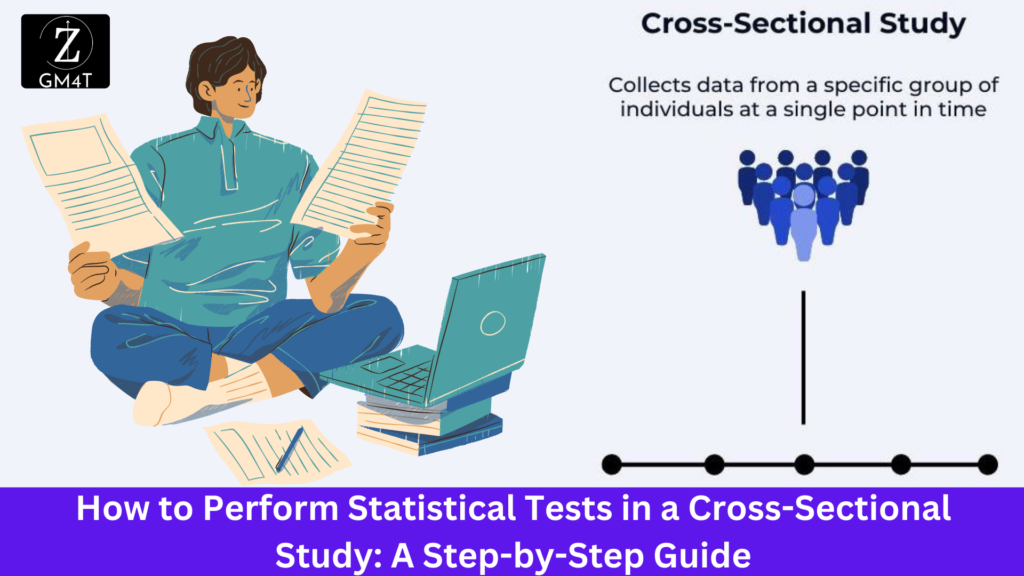
Cross-sectional studies are a powerful tool for understanding the prevalence of conditions and their associations within a specific population. This blog will guide you through the process of collecting data, performing statistical tests, and interpreting the results using a practical example. Let’s use the example of assessing the relationship between social media usage and symptoms of anxiety and depression among college students.

Step 1: Designing the Study and Collecting Data
Study Objective: To evaluate the relationship between social media usage and symptoms of anxiety and depression among college students.
Data Collection:
- Sample: Randomly select 1,000 college students (Please note that sample size calculation is a separate topic. Currently we are just taking this sample hypothetically).
- Variables:
- Independent Variable: Social media usage (measured in hours per day)
- Dependent Variables: Symptoms of anxiety and depression (measured using standardized scales)
Data Collection Form:
| Student ID | Hours of Social Media Usage | Anxiety Score (0-30) | Depression Score (0-30) |
| 001 | 1 | 8 | 10 |
| 002 | 4 | 15 | 20 |
| … | … | … | … |
Step 2: Performing Statistical Analysis
(Please note: We are assuming that the data is normally distributed. Therefore, we are using parametric tests in this example)
1. Descriptive Statistics:
- Calculate the mean, and standard deviation for hours of social media usage, anxiety scores, and depression scores.
- Example:
- Mean hours of social media usage: 3.2 hours/day
- Mean anxiety score: 12.5
- Mean depression score: 15.0
2. Bivariate Analysis:
- Correlation Analysis: Determine the strength and direction of the relationship between social media usage and anxiety/depression scores.
- Use Pearson’s correlation coefficient for continuous variables.
- Example: A Pearson correlation coefficient of 0.45 between social media usage and anxiety score indicates a moderate positive correlation.
- Group Comparison: Compare anxiety and depression scores between high and low social media users.
- Divide participants into two groups: high usage (e.g., >3 hours/day) and low usage (≤3 hours/day).
- Perform an independent t-test to compare the means of anxiety and depression scores between these two groups.
- Example: A t-test reveals a significant difference (p < 0.01) in anxiety scores between high and low social media users.
3. Multivariate Analysis (if applicable):
- Regression Analysis: To account for multiple factors, perform a multiple linear regression analysis with anxiety and depression scores as the dependent variables and social media usage as the independent variable, adjusting for potential confounders like age, gender, and academic stress.
- Example: A regression model shows that social media usage is significantly associated with higher anxiety scores (β = 0.35, p < 0.05) after adjusting for confounders.
Step 3: Interpreting the Results
Findings:
- Descriptive Statistics: On average, students use social media for 3.2 hours a day, with average anxiety and depression scores being 12.5 and 15.0, respectively.
- Correlation Analysis: A moderate positive correlation was found between social media usage and anxiety scores (r = 0.45), indicating that higher social media usage is associated with increased anxiety.
- Group Comparison: High social media users have significantly higher anxiety and depression scores compared to low users (p < 0.01), suggesting a potential impact of social media on mental health.
- Regression Analysis: After adjusting for other variables, social media usage remains significantly associated with higher anxiety scores, supporting the hypothesis that increased social media use may contribute to higher anxiety levels.
Conclusion Statistical tests in cross-sectional studies provide valuable insights into the relationships between variables and the prevalence of conditions. By following these steps—designing the study, collecting data, performing statistical analyses, and interpreting the results—you can draw meaningful conclusions from your data. In our example, the analysis highlighted a potential link between social media usage and increased anxiety among college students, which could inform further research and interventions.

Pingback: Ensuring Healthy Growth in Children through Complementary Feeding – A Crucial Theme of Poshan Maah 2024 - Guideme4thesis