Guideme4thesis (GM4T)

EPIDEMIOLOGY

Understanding Types of Variables in Research: A Comprehensive Guide

Understanding Types of Variables in Research: A Comprehensive Guide

In the world of research, understanding variables is essential. Variables are the building blocks of data analysis, helping researchers uncover relationships, test hypotheses, and derive meaningful conclusions. In this blog, we’ll explore the two major types of variables—numerical and categorical—along with their subtypes, and provide practical examples to clarify these concepts. Numerical Variables: Continuous vs. Discrete Numerical variables are those that can be measured and expressed numerically. They fall into two categories:             1.         Continuous Variables These are variables measured on a continuous scale, meaning they can take any value within a given range. They often involve physical measurements. Example:             •           Weight: A person’s weight can be 65.3 kg, 70.5 kg, or 80.9 kg. The scale is continuous, allowing for decimals.             •           Blood Pressure: Systolic blood pressure values like 120 mmHg or 135.5 mmHg also fall under this category.             2.         Discrete Variables These variables take on a limited number of specific, distinct values, often whole numbers. Example:             •           Number of Diarrheal Episodes: A child may experience 1, 2, or 3 episodes in a year—values are whole numbers and cannot be fractional.             •           Number of Hospital Visits: Patients may visit a hospital 4 or 5 times in a year but never 4.5 times. Key Tip: When analyzing numerical data, consider the nature of the variable (continuous or discrete) to choose the appropriate statistical test. Categorical Variables: Binary, Ordered, and Unordered Categorical variables differ from numerical variables because they represent qualities or categories rather than quantities. These variables have subtypes as well:             1.         Binary (Dichotomous) Variables These variables have only two possible outcomes. Example:             •           Sex: Male or Female.             •           Survival Status: Survived or Died. Binary variables simplify decision-making models and are often the focus in clinical trials.             2.         Unordered Categorical Variables These variables describe categories without a natural ordering. Example:             •           Place of Birth: Categories like Urban, Suburban, and Rural have no inherent rank or sequence.             •           Ethnic Group: Ethnicities are distinct categories but lack a natural order.             3.         Ordered Categorical Variables While non-numerical, these variables have a natural ordering. Example:             •           Social Class: Categories such as Low, Middle, and High are non-numerical but follow a progression from the most deprived to the most affluent.             •           Severity of Disease: Mild, Moderate, Severe—an ordered progression in terms of clinical impact. Interesting Case: Consider a smear test result with categories such as “Negative,” “Uncertain,” and “Positive.” Should this be classified as ordered or unordered? If “Uncertain” is assumed to be an intermediate stage between “Negative” and “Positive,” it may be considered ordered. Otherwise, it would be classified as unordered. Why Understanding Variable Types Matters Knowing the types of variables in your data helps in several ways:             •           Choosing the Right Analysis Method: Continuous variables often require regression analysis, while categorical ones might call for chi-square tests or logistic regression.             •           Interpreting Results Accurately: Misclassifying a variable can lead to incorrect inferences and undermine your research.             •           Tailoring Data Collection: When designing your study, understanding variable types ensures appropriate measurement tools are used. Practical Takeaway Every research study involves variables, whether you’re counting hospital visits, measuring blood pressure, or categorizing social class. By clearly distinguishing between numerical and categorical variables—and their subtypes—you can avoid analytical errors and ensure your research delivers actionable insights. Engage With Us: What types of variables have you encountered in your research, and how did they influence your study design or analysis? Share your experiences in the comments, and stay tuned for more tips on improving your research methodology!

Understanding Types of Variables in Research: A Comprehensive Guide Read More »

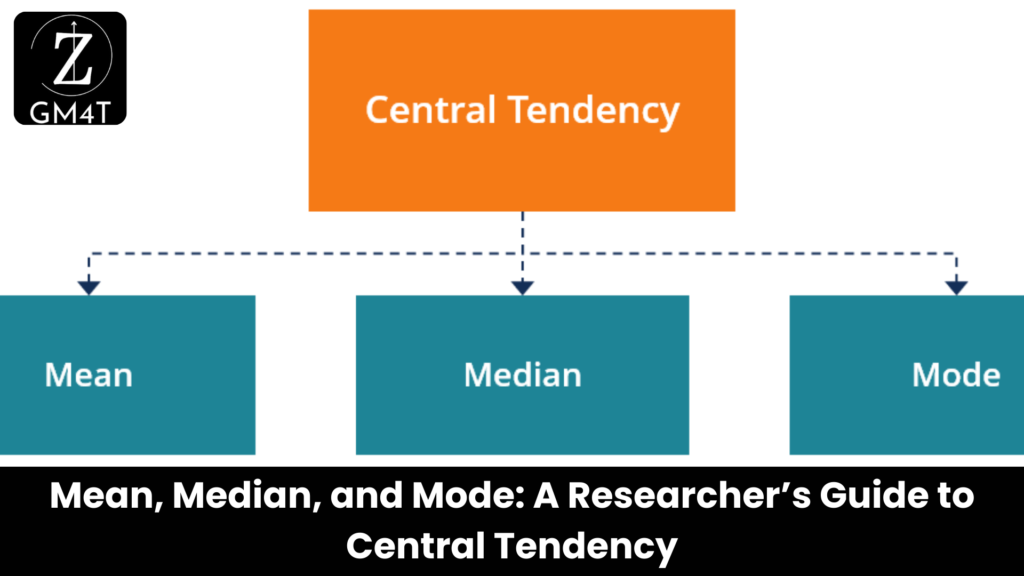
Mean, Median, and Mode: A Researcher’s Guide to Central Tendency

Mean, Median, and Mode: A Researcher’s Guide to Central Tendency

In data analysis, understanding central tendency—the point around which data values cluster—is crucial. The mean, median, and mode are the primary measures of central tendency. Each has its strengths and specific use cases, making them indispensable tools for summarizing data. Let’s explore these concepts with examples and practical applications. 1. Mean (Arithmetic Mean) The mean is the most common measure of average. It’s calculated by summing all data values and dividing by the total number of observations. Formula: Example: Suppose we have exam scores: 80, 85, 90, 95, and 100. Key Features:             •           Strengths: The mean considers all data points, making it ideal for statistical analysis.             •           Limitations: It is sensitive to outliers. For example, adding a score of 300 to the dataset skews the mean upwards to 125, which no longer represents the majority of the data. 2. Median The median is the middle value when observations are ordered from smallest to largest. For an even number of observations, the median is the average of the two middle values. Example: Dataset: 80, 85, 90, 95, 100             •           Median: 90 (the middle value) Dataset: 80, 85, 90, 95, 100, 300             •           Median: Key Features:             •           Strengths: The median is robust against extreme values, making it a better choice when data contains outliers.             •           Limitations: It doesn’t account for the magnitude of other observations, which may oversimplify some datasets. 3. Mode The mode is the value that appears most frequently in a dataset. A dataset can be unimodal (one mode), bimodal (two modes), or multimodal (multiple modes). Example: Dataset: 80, 85, 90, 90, 95, 100             •           Mode: 90 (appears twice) Key Features:             •           Strengths: Useful for categorical data where the most common category is of interest (e.g., the most frequently purchased product).             •           Limitations: Rarely used for numerical data analysis and can be undefined if no value repeats. Comparing Mean, Median, and Mode The relationship between these measures depends on the data’s distribution:             •           Symmetrical Distribution: Mean = Median = Mode             •           Positively Skewed Distribution: Mean > Median > Mode             •           Negatively Skewed Distribution: Mean < Median < Mode Example: In a positively skewed dataset (e.g., incomes where a few people earn significantly more):             •           Mean might overestimate the central tendency.             •           Median provides a more accurate reflection of typical values.             •           Mode indicates the most common income bracket but misses nuances. When to Use Which Measure?             1.         Mean: Best for datasets without outliers, as it incorporates all data points. Use Case: Average exam scores, stock prices.             2.         Median: Preferred when outliers exist, as it reflects the central tendency without being skewed. Use Case: Household income, property prices.             3.         Mode: Useful for identifying the most common category or value. Use Case: Product preferences, survey responses. Special Considerations: Skewed Data In positively skewed data (e.g., incubation periods, income distributions), a geometric mean may be more appropriate than the arithmetic mean. The geometric mean is calculated as the -th root of the product of all values and reduces the impact of extreme values. Final Thoughts Understanding the differences between mean, median, and mode allows researchers to choose the most appropriate measure for their dataset. While the mean is often favored for its mathematical properties, the median and mode provide valuable insights, especially in datasets with outliers or skewed distributions. Engage With Us: Which measure of central tendency do you rely on most in your research? Have you faced challenges with skewed data? Share your experiences in the comments below and stay tuned for more insights on statistical concepts!

Mean, Median, and Mode: A Researcher’s Guide to Central Tendency Read More »

Sampling Variation and Sample Error: Understanding the Precision of Estimates

Sampling Variation and Sample Error: Understanding the Precision of Estimates

In research, when we analyze data from a sample, we’re attempting to make inferences about a larger population. However, since samples are only subsets of the population, they come with inherent variability, known as sampling variation. This variation, combined with the concept of sample error, plays a pivotal role in determining how precisely a sample reflects the population. Let’s explore these ideas in detail. 1. Sampling Variation: The Basis of Variability Sampling variation occurs because different samples from the same population can produce different results. This is due to the random nature of sampling. Example: Imagine taking five different samples of 50 students from a university to estimate the average height of all students. Each sample is likely to yield a slightly different mean because no two samples perfectly represent the population. 2. Sample Error and the Sampling Distribution When we calculate the mean () and standard deviation () from a sample, these values are used to estimate the population mean () and standard deviation (). However, the sample mean rarely matches the population mean exactly, leading to sample error. Key Insight: Sample error reflects how much the sample mean differs from the true population mean due to the randomness of sampling. To understand this, imagine repeatedly drawing many independent samples of the same size () from the population and calculating their means. If we plot these sample means, we get a sampling distribution, which has the following properties:             1.         The mean of the sampling distribution equals the population mean ().             2.         The standard deviation of the sampling distribution, called the standard error (SE), quantifies how precisely the sample mean estimates the population mean. Formula for Standard Error: Where:             •           = population standard deviation             •           = sample size 3. The Role of Sample Size in Standard Error The size of the standard error depends on:             1.         Population Variation (): Greater variability in the population leads to larger SE.             2.         Sample Size (): Larger samples reduce SE, improving the precision of the estimate. Example: If the population standard deviation is 10 and the sample sizes are:             •           ,             •           , Conclusion: A larger sample size reduces the standard error, making the sample mean a more precise estimate of the population mean. 4. Using the Sample Standard Deviation In practice, we rarely know the population standard deviation (). Instead, we use the sample standard deviation () as an estimate, which provides an approximation of the standard error: Practical Application: This formula is used to calculate confidence intervals and conduct hypothesis tests, allowing researchers to quantify the uncertainty in their estimates. 5. Real-World Implications of Sampling Variation and Sample Error             1.         Confidence in Estimates:             •           A smaller standard error implies greater confidence in the sample mean as an estimate of the population mean.             2.         Study Design:             •           When planning a study, researchers often calculate the required sample size to ensure the standard error is small enough to meet their precision goals.             3.         Interpreting Results:             •           Understanding sample error helps researchers explain why results may differ slightly between studies, even when investigating the same population. 6. Visualizing Sampling Variation Imagine plotting the sample means from 1,000 independent samples. The sampling distribution would be narrower for larger samples (smaller SE) and wider for smaller samples (larger SE). This highlights why increasing sample size reduces variability and improves precision. Key Takeaways for Researchers             •           Sampling Variation: Different samples yield different estimates due to randomness, a concept captured by the sampling distribution.             •           Sample Error: Quantifies the discrepancy between the sample mean and population mean.             •           Standard Error: Measures the precision of the sample mean as an estimate of the population mean and decreases with larger sample sizes.             •           Practical Estimation: When the population standard deviation is unknown, the sample standard deviation serves as a reliable substitute. Engage With Us: Have you encountered challenges with sampling variation in your research? How do you ensure your sample size is adequate to minimize standard error? Share your experiences and insights below. Let’s discuss strategies for improving the precision of sample-based estimates! Read Also :-

Sampling Variation and Sample Error: Understanding the Precision of Estimates Read More »

How to Perform Statistical Tests in a Cross-Sectional Study: A Step-by-Step Guide

How to Perform Statistical Tests in a Cross-Sectional Study: A Step-by-Step Guide

Cross-sectional studies are a powerful tool for understanding the prevalence of conditions and their associations within a specific population. This blog will guide you through the process of collecting data, performing statistical tests, and interpreting the results using a practical example. Let’s use the example of assessing the relationship between social media usage and symptoms of anxiety and depression among college students. Step 1: Designing the Study and Collecting Data Study Objective: To evaluate the relationship between social media usage and symptoms of anxiety and depression among college students. Data Collection: Data Collection Form: Student ID Hours of Social Media Usage Anxiety Score (0-30) Depression Score (0-30) 001 1 8 10 002 4 15 20 … … … … Step 2: Performing Statistical Analysis (Please note: We are assuming that the data is normally distributed. Therefore, we are using parametric tests in this example) 1. Descriptive Statistics: 2. Bivariate Analysis: 3. Multivariate Analysis (if applicable): Step 3: Interpreting the Results Findings: Conclusion Statistical tests in cross-sectional studies provide valuable insights into the relationships between variables and the prevalence of conditions. By following these steps—designing the study, collecting data, performing statistical analyses, and interpreting the results—you can draw meaningful conclusions from your data. In our example, the analysis highlighted a potential link between social media usage and increased anxiety among college students, which could inform further research and interventions.

How to Perform Statistical Tests in a Cross-Sectional Study: A Step-by-Step Guide Read More »

Cross-Sectional Study Design: A Snapshot of Epidemiology

Cross-Sectional Study Design: A Snapshot of Epidemiology

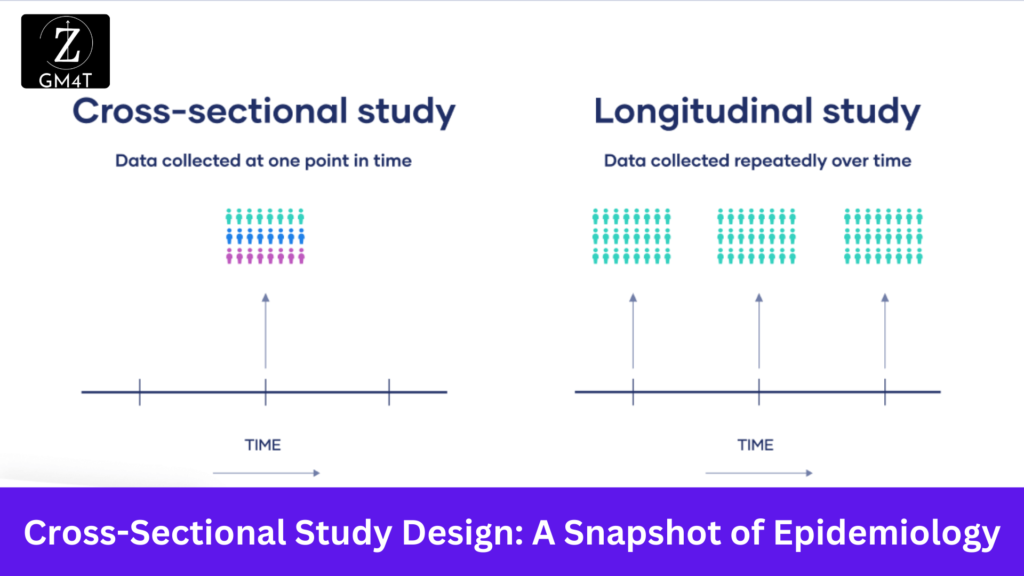
Introduction Cross-sectional study design is a powerful tool in the field of epidemiology and public health. It falls under the umbrella of observational studies, where the investigator does not manipulate the variables but observes them as they naturally occur. The primary goal is to measure both outcomes and exposures at a single point in time, providing a snapshot of the studied population. In this blog, we’ll dive into the essentials of cross-sectional studies, explore how they are designed, and discuss their strengths and limitations using practical examples. Whether you’re a medical student or a budding researcher, understanding this design will enhance your ability to conduct and interpret research effectively. Design of Cross-Sectional Studies In a cross-sectional study, data collection happens simultaneously for both outcomes and exposures. This is different from case-control studies, where participants are selected based on their outcome status, or cohort studies, where participants are chosen based on their exposure status. How It Works: For better understanding, let us go through some hypothetical examples: Example 1: Prevalence of Hypertension in Urban vs. Rural Populations Objective: To compare the prevalence of hypertension between urban and rural populations. Design: Researchers conduct a cross-sectional survey in two distinct areas—one urban and one rural. They randomly select 500 adults from each area. Blood pressure measurements are taken, and participants complete a questionnaire on lifestyle factors such as diet, physical activity, and stress levels. Outcome: The study finds that hypertension is more prevalent in the urban population (30%) compared to the rural population (20%). The researchers also identify higher rates of sedentary lifestyle and higher sodium intake in the urban group. Example 2: Mental Health and Social Media Usage Among College Students Objective: To assess the relationship between social media usage and symptoms of anxiety and depression among college students. Design: A cross-sectional study is conducted with 1,000 college students. Participants complete a survey that includes questions about their daily social media usage and standardized scales for anxiety and depression. Outcome: The results reveal that students who spend more than 3 hours per day on social media have higher scores on both anxiety and depression scales compared to those who use social media less frequently. The study suggests a potential association between excessive social media use and mental health issues. Example 3: Vaccination Coverage and Knowledge of Immunization Among Parents Objective: To evaluate the vaccination coverage rates and parents’ knowledge about immunization in a metropolitan area. Design: Researchers survey 800 parents of children under 5 years of age. They collect data on vaccination records and administer a questionnaire assessing parents’ knowledge about the recommended vaccination schedule and the benefits of vaccines. Outcome: The study finds that 85% of children are up-to-date with their vaccinations. However, parents with limited knowledge about immunization have lower vaccination rates compared to those who are well-informed. The researchers suggest targeted educational campaigns to improve vaccination coverage. Example 4: Dietary Habits and Obesity Prevalence in Adolescents Objective: To determine the relationship between dietary habits and obesity prevalence among adolescents. Design: A cross-sectional study surveys 600 adolescents from multiple high schools. Participants provide information about their dietary habits through food frequency questionnaires and undergo measurements of height and weight to calculate BMI. Outcome: The study finds that adolescents with high consumption of sugary snacks and fast food have a significantly higher prevalence of obesity (25%) compared to those with healthier dietary habits (15%). The researchers recommend interventions to promote healthier eating habits among adolescents. Example 5: Smoking Status and Respiratory Symptoms in Workers Objective: To assess the prevalence of respiratory symptoms among smokers and non-smokers in an industrial setting. Design: Researchers conduct a cross-sectional survey among 400 workers in an industrial factory. They collect data on smoking status and self-reported respiratory symptoms such as cough, wheezing, and shortness of breath. Outcome: The study reveals that smokers experience a higher prevalence of respiratory symptoms (40%) compared to non-smokers (20%). The findings highlight the impact of smoking on respiratory health and suggest the need for smoking cessation programs in the workplace. These examples showcase how cross-sectional studies can reveal important epidemiological data and guide public health interventions. Applications and Measurements Cross-sectional studies offer a versatile approach to gathering data and assessing various health and behavioral factors. Here are some practical applications based on the examples we just discussed: Strengths of Cross-Sectional Studies Limitations of Cross-Sectional Studies Conclusion Cross-sectional studies offer valuable insights into the prevalence of health conditions and associated factors at a specific point in time. While they provide useful data for public health and epidemiological research, they have limitations in establishing causality. By understanding and applying these principles, researchers can design effective studies and contribute meaningfully to public health knowledge. Read Also :-

Cross-Sectional Study Design: A Snapshot of Epidemiology Read More »

How to Calculate Sample Size for Medical Research - A Guide to Ethical and Effective Studies

How to Calculate Sample Size for Medical Research – A Guide to Ethical and Effective Studies

A formal sample size calculation, justifying the proposed study size and demonstrating that the study is capable of answering the questions posed, is now a component of a research proposal required by most funding agencies. Too often, medical research studies have been too small, because the sample size was decided on purely logistic grounds, or by guesswork. This is not only bad practice: it is considered by many to be unethical because of the waste of time and potential risk to patients participating in a study that cannot answer its stated research question. On the other hand, studying many more persons than necessary is also a waste of time and resources. In a clinical trial, conducting a study that is too large may also be unethical, because this could mean that more persons than necessary were given the placebo, and that the introduction of a beneficial therapy was delayed. Calculating the required sample size requires that we quantify the objectives of our study.

How to Calculate Sample Size for Medical Research – A Guide to Ethical and Effective Studies Read More »

Scenario: Assessing Knowledge About Cervical Cancer Among Medical Students

Scenario: Assessing Knowledge About Cervical Cancer Among Medical Students

Discover: Scenario: Assessing Knowledge About Cervical Cancer Among Medical Students – Imagine you’re working on a research project to gauge how much medical students at ABC Medical College know about cervical cancer. You want to make sure your study is well-planned and follows a clear methodology. Here’s how you can outline your approach: 1. Study PopulationThe study population will consist of undergraduate and postgraduate medical students currently enrolled at ABC Medical College. This group is chosen due to their advanced education in medical sciences, which makes them relevant for evaluating knowledge about cervical cancer. 2. Study AreaThe study will be carried out at ABC Medical College in City XYZ. The college’s diverse student body and its focus on comprehensive medical education provide an ideal setting for assessing cervical cancer knowledge. 3. Study DesignThis will be a cross-sectional study designed to assess knowledge about cervical cancer among medical students at ABC Medical College. This design allows for a snapshot of students’ understanding at one point in time, providing a clear view of their current knowledge. 4. Study DurationThe study will be conducted over a period of 3 months, starting in January 2025 and concluding in March 2025. The duration includes 1 month for distributing and collecting the surveys and 2 months for analyzing the data and preparing the final report. 5. Sample SizeBased on the assumption of 50% baseline knowledge, with a 95% confidence interval and a 5% margin of error, the study will include 384 medical students. This sample size is calculated to provide reliable and significant results. 6. Inclusion and Exclusion CriteriaInclusion criteria: All undergraduate and postgraduate medical students currently enrolled at ABC Medical College. Exclusion criteria: Students who are on academic or medical leave during the study period will be excluded from the study. 7. Study ProcedureFollowing ethical approval, participants will be recruited through campus announcements and email invitations. A structured questionnaire designed to assess knowledge about cervical cancer will be distributed. Data collection will take place over 4 weeks, with follow-up reminders sent to maximize response rates. 8. Data Collection ToolsData will be collected using a structured questionnaire comprising multiple-choice, true/false, and short answer questions. This questionnaire has been validated in previous studies to ensure reliability and accuracy in measuring knowledge. 9. Outcome VariablesThe primary outcome variable is the level of knowledge about cervical cancer, assessed through the scores obtained from the questionnaire. Secondary outcomes will include variations in knowledge levels based on academic year and gender, providing additional insights into factors influencing knowledge.

Scenario: Assessing Knowledge About Cervical Cancer Among Medical Students Read More »

How to Write the Methodology in a Study

How to Write the Methodology in a Study

1. Study PopulationDescribe the specific group of individuals or entities your study will focus on. Include demographic details such as age, gender, health status, or other relevant characteristics. Justify why this population is relevant to your research question. Example:“The study population will include adults aged 50 to 75 years diagnosed with chronic obstructive pulmonary disease (COPD) who are receiving treatment at XYZ Clinic. This age group is targeted due to the higher incidence of COPD and its impact on quality of life.” 2. Study AreaSpecify the geographic location and/or institutional setting where the study will be conducted. Mention any particular features of this area that make it suitable for your research. Example:“The study will be conducted in the urban slum areas of City ABC, where access to healthcare services is limited. This setting is chosen to evaluate the effectiveness of a new mobile health intervention.” 3. Study DesignOutline the type of study design you will use (e.g., cross-sectional, cohort, case-control, randomized controlled trial) and explain why this design is appropriate for addressing your research question. Example:“This will be a randomized controlled trial (RCT) to evaluate the efficacy of a new antihypertensive medication. The RCT design is selected to minimize biases and provide high-quality evidence on the medication’s effectiveness.” 4. Study DurationDetail the timeline of the study, including start and end dates, and any significant phases or milestones. Example:“The study will span 18 months, beginning in March 2025 and concluding in September 2026. The duration includes a 6-month recruitment phase followed by a 12-month intervention period and data analysis.” 5. Sample SizeDescribe how many participants will be included in the study and the rationale behind this number. Mention any statistical calculations or methods used to determine the sample size. Example:“Based on a power analysis, a sample size of 200 participants is required to detect a significant difference in outcomes with 80% power and a 5% significance level. This number accounts for potential dropouts and ensures the study’s robustness.” 6. Inclusion and Exclusion CriteriaDefine the criteria for selecting participants for the study and any reasons for excluding certain individuals. This helps in ensuring that the study sample is representative and appropriate for the research objectives. Example:“Inclusion criteria: Adults aged 50-75 with a diagnosis of COPD and stable medication regimen. Exclusion criteria: Individuals with comorbidities that could interfere with the study outcomes, such as advanced heart disease or cancer.” 7. Study ProcedureDetail the step-by-step process of how the study will be conducted, including recruitment, intervention (if applicable), and follow-up procedures. Example:“Participants will be recruited through clinic referrals and advertisements. After obtaining informed consent, they will be randomly assigned to either the intervention or control group. The intervention group will receive the new medication for 6 months, while the control group will receive a placebo. Follow-up assessments will be conducted at 3 and 6 months.” 8. Data Collection ToolsSpecify the tools and methods used to collect data, such as surveys, interviews, laboratory tests, or other instruments. Mention any validated tools or procedures. Example:“Data will be collected using a combination of structured questionnaires, physical health assessments, and laboratory tests. The questionnaires have been validated for reliability and validity in similar studies.” 9. Outcome VariablesIdentify the primary and secondary outcome variables that the study will measure. Explain how these variables will be assessed and their relevance to the research question. Example:“The primary outcome variable is the reduction in systolic blood pressure, measured using an automated blood pressure monitor. Secondary outcomes include changes in cholesterol levels and quality of life, assessed using standardized questionnaires.” Read Also :- Our Services – Click here

How to Write the Methodology in a Study Read More »

Why Getting Your Methodology Right Matters?

Why Getting Your Methodology Right Matters?

Discover Why Getting Your Methodology Right Matters? – When you dive into a research study, the methodology section is like the roadmap guiding the entire journey. It’s where you lay out exactly how you’re going to tackle your research question, from picking your study group to collecting and analyzing your data. Getting this part right is crucial—it’s what makes your study credible and trustworthy. Why Your Methodology is a Big Deal? Think of the methodology as the playbook for your study. It includes everything from who you’ll study and where, to how you’ll gather and look at your data. A well-written methodology makes sure that: What Happens If You Get It Wrong? Skipping on a detailed methodology can lead to a bunch of problems: In short, the methodology section is a crucial part of your study. It’s not just about following a checklist; it’s about laying out a clear, detailed plan that makes your research trustworthy and useful. A solid methodology helps ensure that your study stands up to scrutiny, can be replicated, and provides clear, reliable results. Read Also :- Our Services – Click here

Why Getting Your Methodology Right Matters? Read More »

The Art of Reviewing Literature

The Art of Reviewing Literature

Discover – The Art of Reviewing Literature :- Reviewing literature involves examining existing research to understand the current state of knowledge on a specific topic. It helps to identify gaps, inconsistencies, and areas needing further exploration. Reviewing literature forms the foundation of your introduction and discussion sections. The introduction sets the context for your study, while the discussion compares your findings with previous research, highlighting your study’s contributions and relevance. By thoroughly reviewing the literature, you build a strong foundation for your research, ensuring that your study is well-grounded and relevant. Embrace this critical step, and you’ll pave the way for impactful, high-quality research.

The Art of Reviewing Literature Read More »

Open chat
Hello 👋
Can we help you?