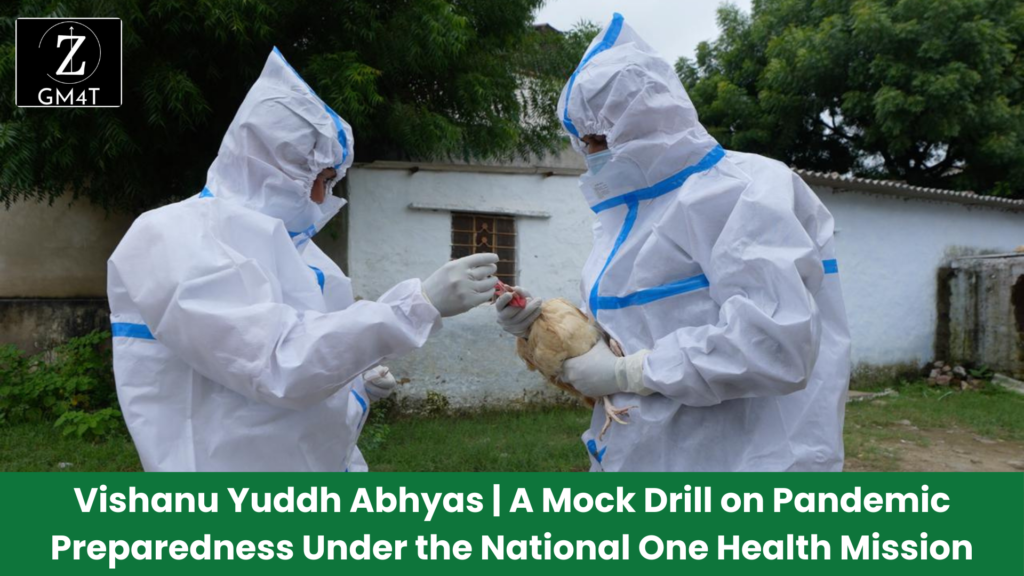
Vishanu Yuddh Abhyas | A Mock Drill on Pandemic Preparedness Under the National One Health Mission
Discover – Vishanu Yuddh Abhyas | A Mock Drill on Pandemic Preparedness Under the National One Health Mission – In a world increasingly threatened by the risk of zoonotic diseases, cross-sectoral collaboration between human, animal, and environmental health sectors is crucial to preventing and managing outbreaks. Recognizing this, India conducted its first-ever comprehensive pandemic preparedness mock drill, Vishanu Yuddh Abhyas (Virus War Exercise), under the aegis of the National One Health Mission (NOHM). The exercise, held in Rajasthan’s Ajmer district from August 27 to August 31, 2024, served as a robust test of the country’s ability to respond to a zoonotic disease outbreak, bringing together experts from human health, animal husbandry, and wildlife sectors. Mission Objectives and Structure Vishanu Yuddh Abhyas aimed to evaluate the readiness of India’s National Joint Outbreak Response Team (NJORT) by simulating a zoonotic disease outbreak. The drill was structured into two critical components: This exercise was a landmark event for India’s One Health mission, involving diverse stakeholders such as the National Centre for Disease Control (NCDC), Indian Council of Medical Research (ICMR), Department of Animal Husbandry and Dairying (DAHD), and the Ministry of Environment, Forest, and Climate Change (MoEF&CC). Other key players included state authorities, district administration, and specialized labs like AIIMS Jodhpur BSL-3 Lab, one of India’s 19 National BSL-3 Network Laboratories. The Role of One Health The One Health approach, which emphasizes the interconnectedness of human, animal, and environmental health, is central to India’s pandemic preparedness strategy. The National One Health Mission envisions integrated disease surveillance and early warning systems that rely on cross-sectoral collaboration and advanced data analytics. The Vishanu Yuddh Abhyas exercise was a practical demonstration of this approach. It showcased how shared surveillance data from sectors such as human health, animal husbandry, and wildlife can inform early detection and rapid response to emerging threats. By simulating real-world conditions, the mock drill underscored the importance of coordination across different government bodies and the use of sentinel-based environmental surveillance to detect pathogens in sources like sewage, vectors, and animal trade. Key Components of the One Health Mission Critical Analysis: Strengths, Weaknesses, Opportunities, and Threats The Vishanu Yuddh Abhyas mock drill highlighted several strengths of India’s One Health approach, particularly the emphasis on cross-sector collaboration and the integration of surveillance systems across human, animal, and environmental sectors. The drill demonstrated India’s growing capacity for rapid detection and response, using tools such as environmental surveillance and BSL-3 laboratories. However, significant weaknesses persist. There remains a gap in interagency coordination, especially at the district level where resources are limited and communication between human, animal, and wildlife sectors is still evolving. The effective deployment of digital and environmental surveillance tools depends heavily on infrastructural support, which is unevenly distributed across India. The opportunities presented by the One Health approach are vast. By strengthening cross-sectoral collaboration, India can enhance its preparedness not just for zoonotic diseases but also for emerging threats like antimicrobial resistance (AMR). With better resource allocation and continued investment in surveillance technologies, India has the potential to lead global efforts in pandemic preparedness. Yet, threats remain, especially in the form political will and resource constraints. The success of future pandemic response strategies will depend on how well India can address these challenges, especially in rural and underserved regions where zoonotic diseases often originate. Read Also :-